


The scatterplot shows the relationship between two variables, and .
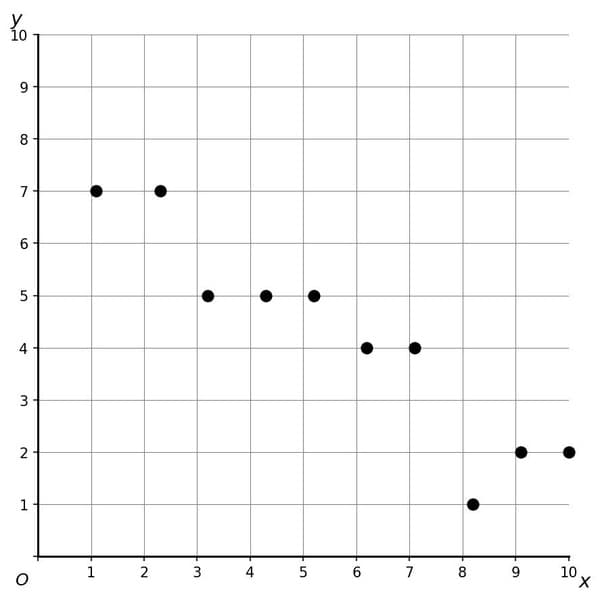
Which of the following equations is the most appropriate linear model for the data shown?
Explanation
Context: A scatterplot shows a decreasing trend. Near , ; near , .
Answer:
Why: The data decreases, requiring negative slope. The -intercept extrapolates to about . Slope . Checking: at , (matches data –).
Traps:
- A (): Massive positive slope — completely wrong direction.
- B (): Slope is absurdly steep; -intercept is way too low.
- C (): Good -intercept but positive slope contradicts the decreasing data.