


The scatterplot shows the relationship between two variables, and . A line of best fit is also shown.
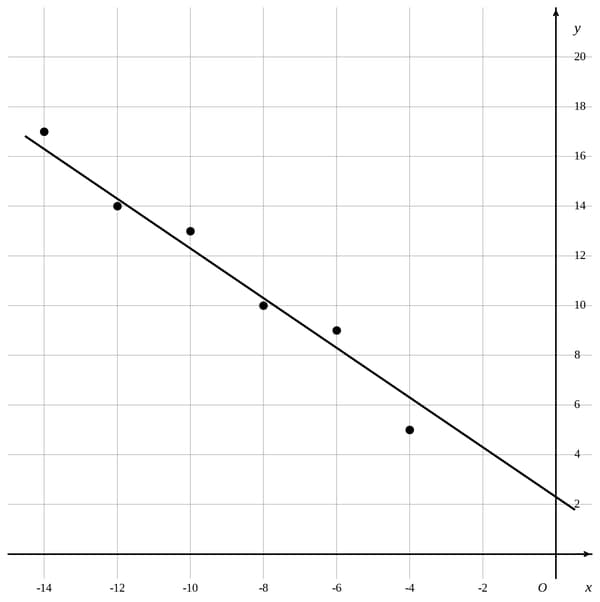
Which of the following equations best represents the line of best fit shown?
Explanation
Context: Scatterplot (negative -range). Line through and .
Answer:
Why: Slope . y-intercept .
Traps:
- A () and C (): Positive slope.
- B (): Correct slope but wrong y-intercept.