


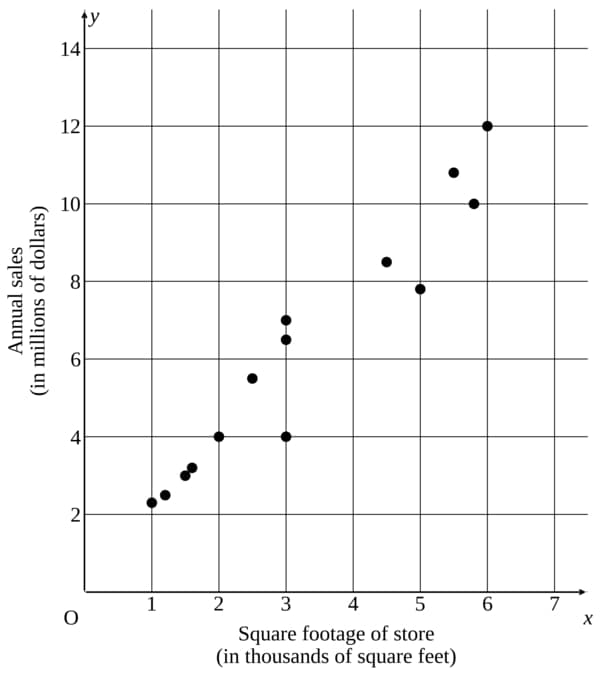
The scatterplot shows the relationship between the square footage of clothing stores and their annual sales, in millions of dollars. According to the trend shown by the data, which of the following is the best prediction for the annual sales, in millions of dollars, of a clothing store that is thousand square feet?
Explanation
Context: Scatterplot of 12 clothing stores: square footage (thousands) vs annual sales (millions). Predict at .
Answer: C) million
Why: Following the positive trend, at thousand square feet, the data clusters around – million. is the best prediction.
Traps: (A) matches the trend near . (B) is below the trend at . (D) matches the trend near –.