


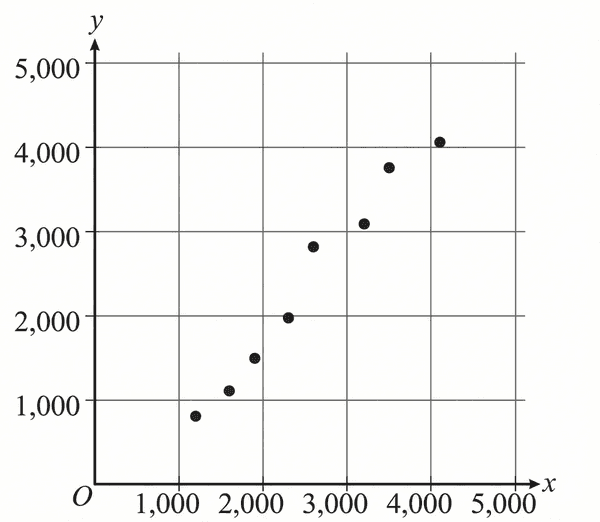
The scatterplot shows the relationship between two variables, and Which of the following equations is the most appropriate model for the data shown?
Explanation
Context: Scatterplot showing positive linear trend from about to .
Answer: The data follows a straight-line pattern (not curved), so exponential models are wrong. The slope is positive. Verify: at , ; at , . Both match.
Why A: Linear model with positive slope fits the straight-line data.
Traps:
- (B) — negative slope; data clearly increases.
- (C) — exponential with negative coefficient; gives negative -values.
- (D) — exponential growth; data is linear, not curved.