


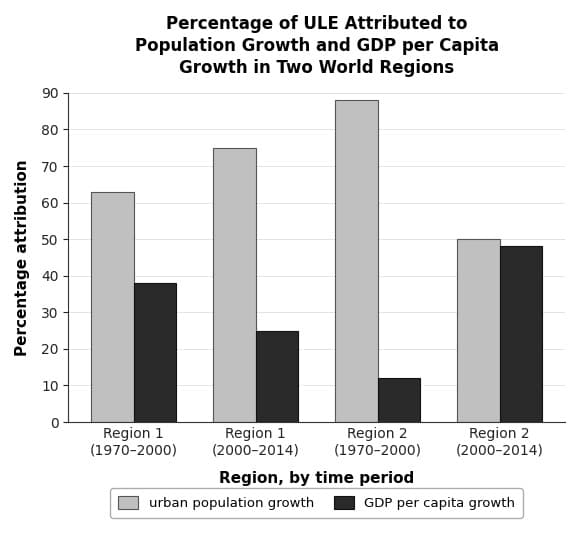
In a study of urban physical expansion, Richa Mahatta et al. conducted a meta-analysis of more than 300 cities worldwide to determine whether urban land expansion (ULE) was more strongly influenced by urban population growth or by growth in gross domestic product (GDP) per capita, a measure of economic activity. Because efficient national government is necessary to provide urban services and infrastructure that attract economic investment, Mahatta et al. propose that absent other factors, the importance of GDP per capita growth to ULE would likely increase relative to the importance of population growth as governments become more efficient. If true, this suggests the possibility that _______
Which choice most effectively uses data from the graph to complete the statement?
Explanation
Context: The researchers propose that as national governments grow more efficient, GDP per capita growth should account for more of urban land expansion relative to population growth. The graph gives each factor's percentage attribution for two regions across 1970 to 2000 and 2000 to 2014.
Answer: B) national governments of countries in Region 1 experienced declines in efficiency in the period from 2000 to 2014, relative to the period from 1970 to 2000.
Why? Read the proposed relationship backward: a shrinking GDP share signals falling efficiency. In Region 1 the GDP per capita attribution drops from 38 to 25 percent while population growth rises from 63 to 75 percent, which points to less efficient government.
Traps:
- A) The bars report shares of urban land expansion, not rates of economic growth, and the choice credits Region 1 with rising efficiency that its falling GDP share contradicts.
- C) Region 1's GDP share fell while Region 2's climbed from 12 to 48 percent, so the regions moved in opposite directions.
- D) The data are aggregated by region, so nothing distinguishes "most" countries in Region 2 from "several" exceptions.