


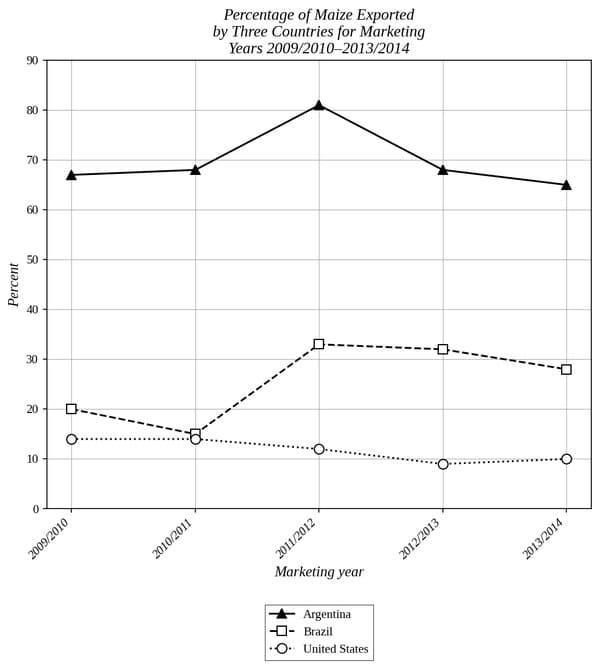
Argentina, Brazil, and the United States are among the world's leading producers of maize (corn), and each country exports a certain percentage of maize each marketing year, which runs from March to February in Argentina and Brazil and from September to August in the United States. A student is researching those percentages and finds that for the marketing year 2012/2013, the percentage of maize exported by _______
Which choice most effectively uses data from the graph to complete the text?
Explanation
Context: A line graph plots the percentage of maize exported by Argentina, Brazil, and the United States across five marketing years. The sentence needs a statement that the graph supports for 2012/2013.
Answer: D) Argentina decreased from the previous marketing year but remained the highest among the three countries.
Why? Argentina falls from about 81 percent in 2011/2012 to about 68 percent in 2012/2013, yet that 68 still tops Brazil's roughly 32 percent and the United States' roughly 9 percent in the same year.
Traps:
- A) Brazil never passes Argentina anywhere on the graph; in 2012/2013 it trails by more than 30 percentage points.
- B) Brazil edges down from about 33 to about 32 percent rather than rising, and at 32 it sits far above the United States, not below it.
- C) The United States is at its lowest point in 2012/2013, near 9 percent; its highest reading is about 14 percent in the first two marketing years.