


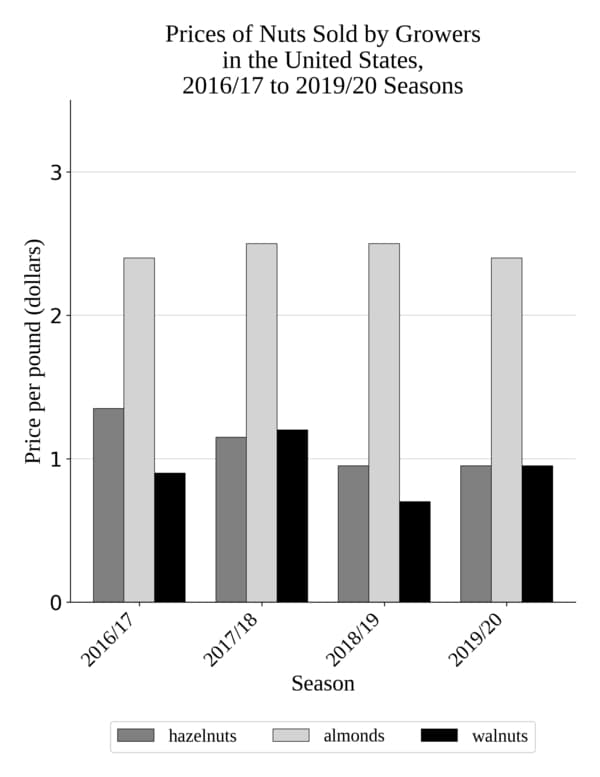
The US Department of Agriculture’s Fruit and Tree Nuts Outlook is a document that covers a variety of subjects, from the influence of changing climate on agricultural production to the effect of stinkbug damage on pear crops. A student studying agricultural economics is consulting a graph in the document that shows the prices for which several types of nuts have been sold by growers in the United States over four growing seasons from 2016 to 2020. The student wishes to determine in which season walnuts reached their lowest price. Consulting the graph, the student finds that this season was the ______
Which choice most effectively uses data from the graph to complete the statement?
Explanation
Context: A student is consulting a graph of grower prices for hazelnuts, almonds, and walnuts across the 2016/17 through 2019/20 seasons to find when walnuts were cheapest.
Answer: D) 2018/19 season.
Why? The walnut bars run about 1.20, 0.95 per pound across the four seasons in order, so the shortest walnut bar, roughly $0.70, stands over 2018/19. No other season brings walnuts anywhere near that low. Only the walnut series matters here; the hazelnut and almond bars are not part of the question.
Traps:
- A) 2016/17 → walnuts sold for about $0.90, above the 2018/19 low.
- B) 2017/18 → about $1.20, the highest walnut price of the four seasons.
- C) 2019/20 → about $0.95, still above 2018/19.