


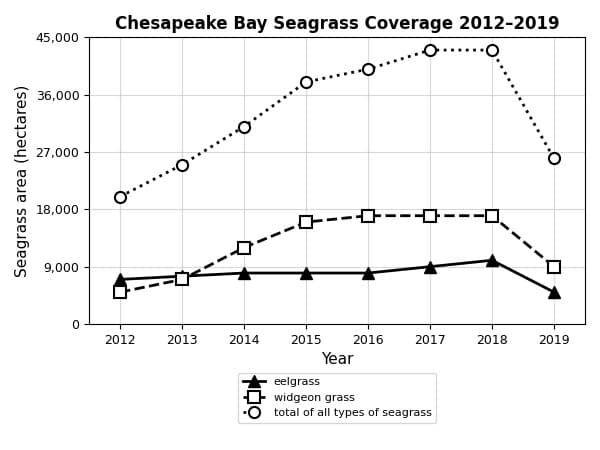
Chesapeake Bay seagrass meadows constitute crucial habitats for many aquatic species. Historically, eelgrass has been predominant, but widgeon grass is proving better suited to recent increases in sea temperature, tolerating heat better and growing faster than eelgrass does. Although the increase in widgeon grass has been associated with a substantial increase in total seagrass coverage in the bay, researchers caution that the latter change does not necessarily make the seagrass ecosystem as a whole more resilient to environmental shocks.
Which statement, if true, would account for data shown in the graph and would illustrate the point made by the researchers?
Explanation
Context: Widgeon grass has been outcompeting eelgrass as the bay warms and has driven total seagrass coverage up, but researchers warn that more coverage does not mean a more resilient ecosystem. The graph tracks eelgrass, widgeon grass and total seagrass from 2012 to 2019.
Answer: A) In early 2019, unusually heavy rains washed excessive nutrients into the bay, leading to algal blooms that prevented sunlight from reaching many seagrass species.
Why? Every series collapses in 2019, total coverage falling from about 43,000 to about 26,000 hectares and widgeon grass from about 17,000 to about 9,000. A shock that blocks sunlight for many species at once explains a drop that spares nothing, showing the enlarged meadows were fragile.
Traps:
- B) An outbreak in early 2018 does not fit the graph, where all three lines hold steady or rise through 2018 and only fall the following year.
- C) The rise from 2012 to 2017 is described accurately, but that is the growth the researchers already grant, not a shock that tests resilience.
- D) If only widgeon grass could tolerate a 2019 heat spike, widgeon grass should have held its ground; instead it fell by roughly half that year.