


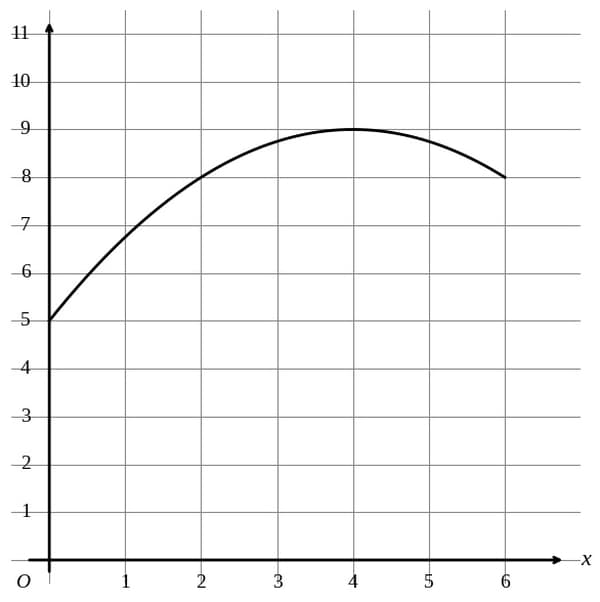
The graph models the number of active projects a company was working on months after the end of November , where . According to the model, what is the predicted number of active projects the company was working on at the end of November ?
Explanation
Context: The graph models active projects a company was working on, months after the end of November 2013, where . The curve starts at , rises to a peak near , then declines. Question asks for the predicted number at the end of November 2013.
Answer: B — 5
Why: "At the end of November 2013" corresponds to (zero months after November 2013). At , the graph starts at . The y-intercept gives the starting value: 5 active projects.
Traps:
- A (0): The graph does not start at the x-axis — it starts well above at .
- C (8): This is close to the peak value around (about 3 months later), not the starting value at .
- D (9): This is approximately the maximum of the graph, which occurs around , not at .