


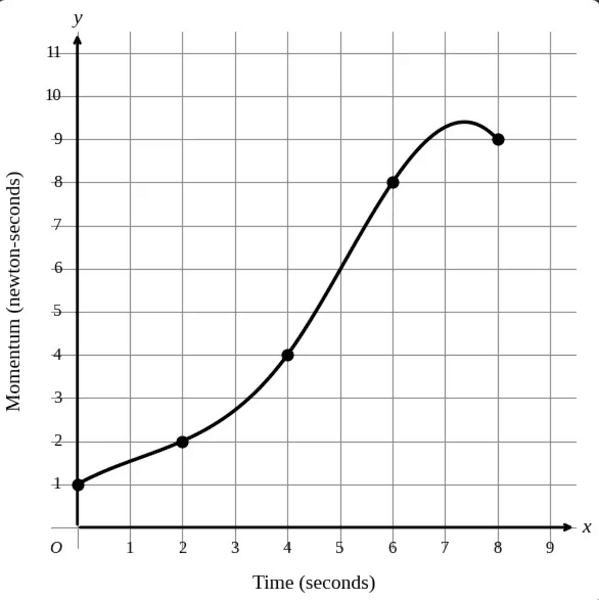
The graph shows the momentum , in newton-seconds, of an object seconds after the object started moving, for . What is the average rate of change, in newton-seconds per second, in the momentum of the object from to ?
Enter a number or fraction, e.g. 5, 0.5, 1/2
Explanation
Context: The graph shows momentum (newton-seconds) against time (seconds), with points marked at , , , and . We need the average rate of change from to .
Setup: Average rate of change is the slope of the straight line joining the two endpoints of the interval:
Read the two values off the graph:
- At the marked point is at , so .
- At the marked point is at , so .
Solve:
Answer:
Note that and are both ways to enter a correct answer.
Common slips:
- Reading as by taking the marked point at instead of . That gives , which is the most common wrong answer here — count the gridlines carefully.
- Using the endpoints of the whole graph, and , which gives rather than the rate over the requested interval.
- Finding the slope at a single instant rather than the average across the interval. Average rate of change only needs the two endpoints; the shape of the curve between them does not matter.