


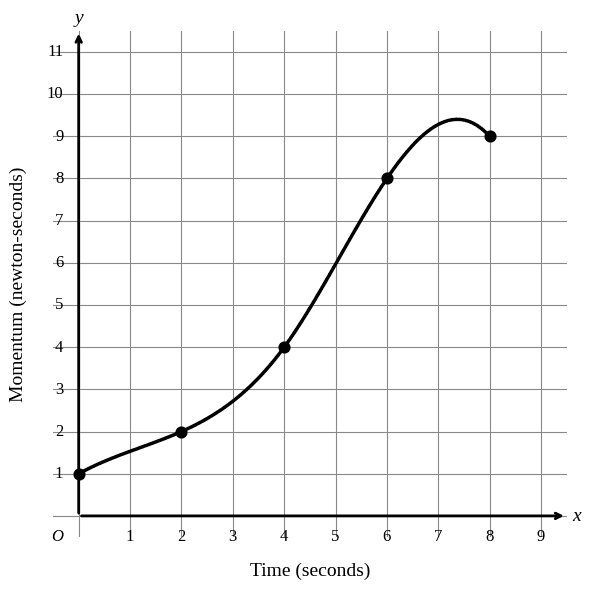
The graph shows the momentum , in newton-seconds, of an object seconds after the object started moving, for . What is the average rate of change, in newton-seconds per second, in the momentum of the object from to ?
Enter a number or fraction, e.g. 5, 0.5, 1/2
Explanation
Context: Graph of momentum (newton-seconds) vs time (seconds) for . Marked points on the curve include and . Find the average rate of change from to .
Answer: 1.5
Why: Average rate of change newton-seconds per second.
Verification: The marked dots clearly sit at and , confirming both readings. exactly. ✓