


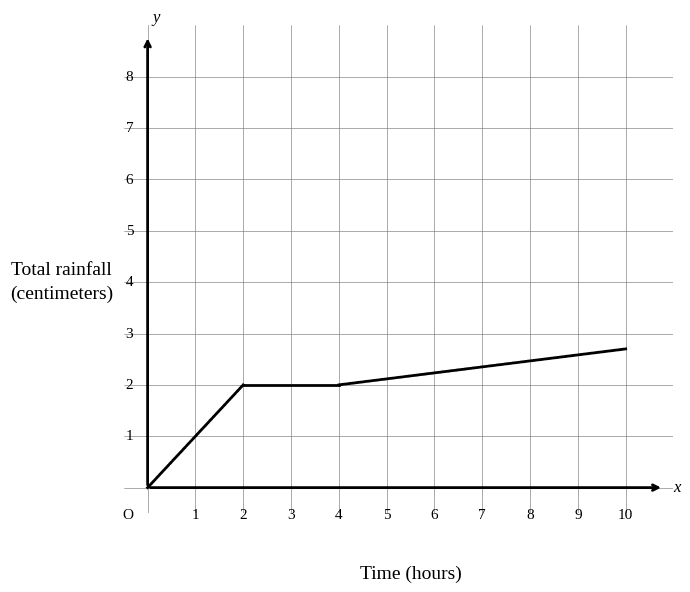
The graph shows the total amount of rainfall y, in centimeters, from the start of a -hour period, where x is the number of hours after the start of the period. Which of the following statements about the rainfall during this time period is true?
Explanation
Context: Graph of total rainfall (cm) vs time (hours) over a -hour period. Three segments: increasing linearly (–), flat (–), increasing linearly (–).
Answer: D — The rate of rainfall was centimeters per hour between and .
Why: From to , the graph is flat (slope ), meaning total rainfall did not change. No new rain fell during that -hour period, so the rate was cm/hr.
Traps:
- A (Rate was cm/hr between and ): The flat segment has slope , not .
- B (Greatest rate between and ): The steepest segment is from to , not to .
- C (Rate increased between and ): The rate (slope) was constant during this segment — a straight line means constant rate, not increasing rate.